Welcome

Tommaso
Corradini

Aerospace engineer specialised in fluid dynamics, aerodynamics and CFD, from high-lift icing simulations with industry partners to airport noise modelling and orbital risk.

Curriculum vitae

Aerospace Engineer

Strong technical background in fluid dynamics, aerodynamics and computational methods, with experience in CFD simulation, structural analysis and system dynamics. Methodical and detail-oriented, used to working in technical teams and delivering rigorous engineering analysis under demanding conditions.

3Degree programmes
2Countries studied in
4Industry partners on thesis
2Languages spoken

Academic timeline

2025 – 2026 · Cranfield, United Kingdom
Cranfield University
MSc in Aerospace Dynamics
2025 – 2026
European Institute of Innovation for Sustainability
Master in Space Entrepreneurship
2019 – 2024 · Padua, Italy
University of Padua
BSc in Aerospace Engineering

Languages

ItalianNative
EnglishC1 (IELTS 7.0)
Strengths
Strategic planning Effective communication Adaptability Teamwork & collaboration

Software

CFD & meshing
ANANSYS Fluent
PWPointwise
Transonic aerodynamic design
VGVGK / VGKD
VFVFP
Programming & technical computing
MLMATLAB
PYPython
Design & other
3DCAD modelling
XLExcel
Projects

CFD & research work

2025 – 2026 · MSc Thesis

CFD on icing effects: NASA CRM high-lift configuration

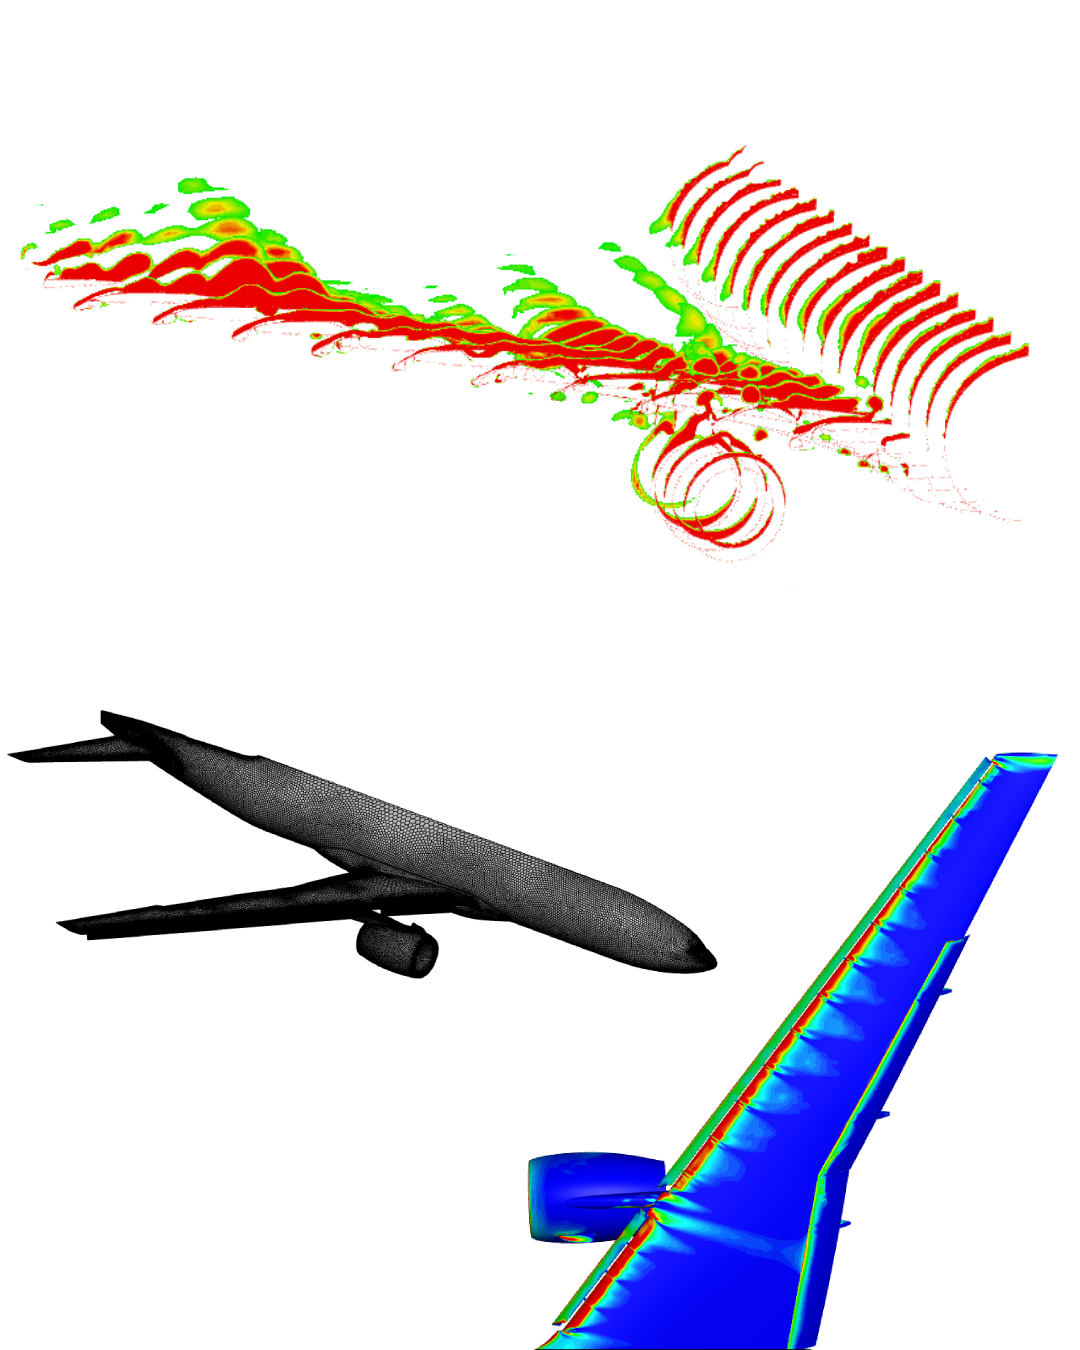
RANS simulations in ANSYS Fluent on the NASA Common Research Model high-lift configuration, assessing lift and moment degradation caused by ice accretion during landing at full-scale Reynolds numbers, carried out at Cranfield University.

Industrial partners
AirbusETWBoeingNASA
See more +See less −

The project responds to evolving CS-25 airworthiness regulations, which place greater emphasis on the aerodynamic penalties of ice accretion on civil airliners. The aim was to quantify how realistic ice shapes change the lift and pitching-moment behaviour of a modern transport-aircraft high-lift system at full-scale Reynolds numbers.

It was carried out as a research project in collaboration with Airbus, the European Transonic Windtunnel (ETW), Boeing and NASA.
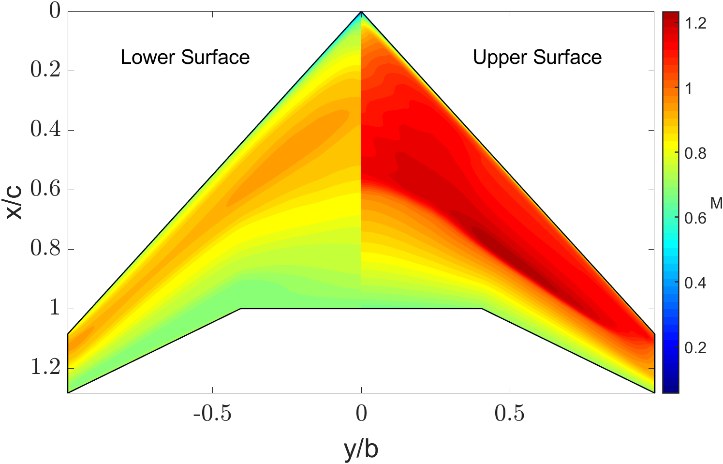
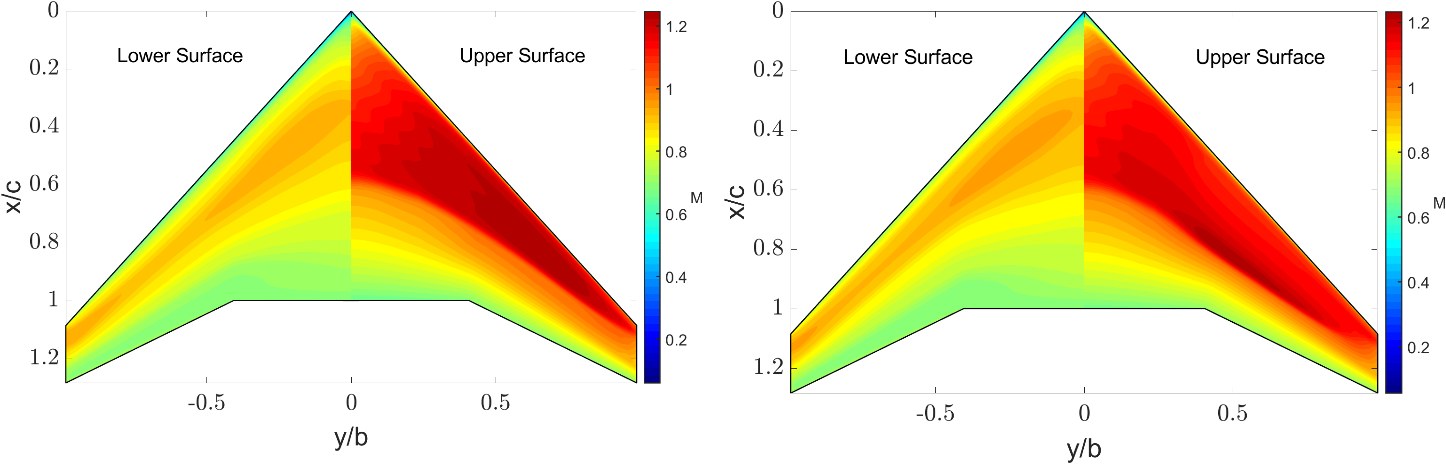
Mach number contours on the upper and lower surface of the redesigned transonic wing
Mach number contours on the redesigned wing at M = 0.8, α = 2°.
2026 · Transonic Aerodynamic Design

Transonic wing design: crank section

Aerodynamic redesign of the crank section of a swept civil-transport wing cruising at Mach 0.8. Using inverse design in VGKD, 2D analysis in VGK and full-wing analysis in VFP, the section was reshaped into a more supercritical profile with a longer, weaker-shock rooftop.

Inverse designSupercritical aerofoilsVGK / VGKDVFP
0.91Korn factor (from 0.88)
−14%Total drag at α = 3.5°
See more +See less −

The wing cruises at M = 0.8, Re = 4 million and α = 2°. Applying simple sweep theory to the 25° quarter-chord sweep, the sections were designed in 2D at an effective Mach number of 0.725. The goal was a supercritical profile with a supersonic “rooftop” and an efficient, weak-shock pressure recovery, tracked through the Korn technology factor and the drag-divergence Mach number.

  • First approach: designing at an effective angle of attack corrected for downwash (lifting-line theory) did not beat the baseline, with the Korn factor dropping to 0.85–0.88 and lift and efficiency down by about 2–3%.
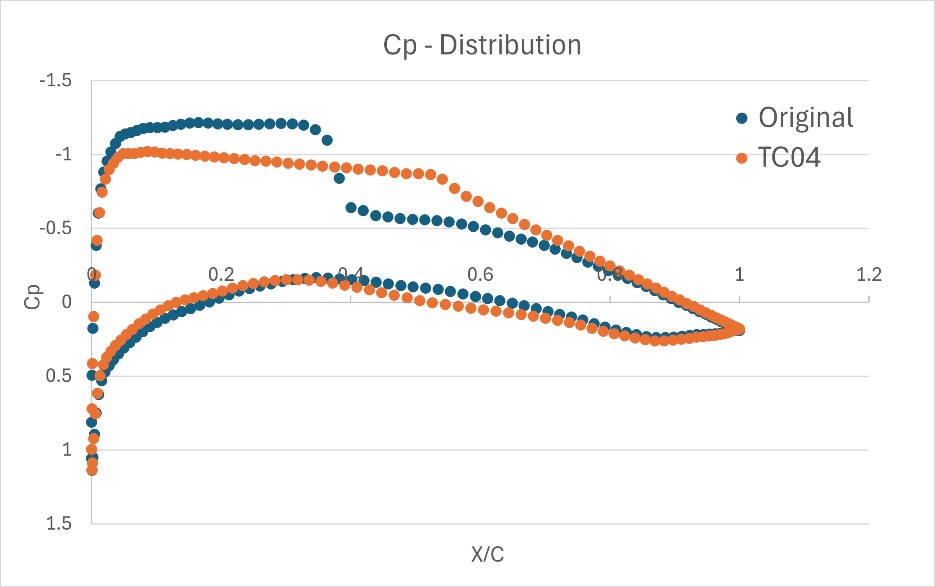
  • Final approach: designing at the fixed geometric angle, five candidates were produced. The selected one, TC04, raised the Korn factor from 0.88 to 0.91 and the drag-divergence Mach number from 0.711 to 0.715.
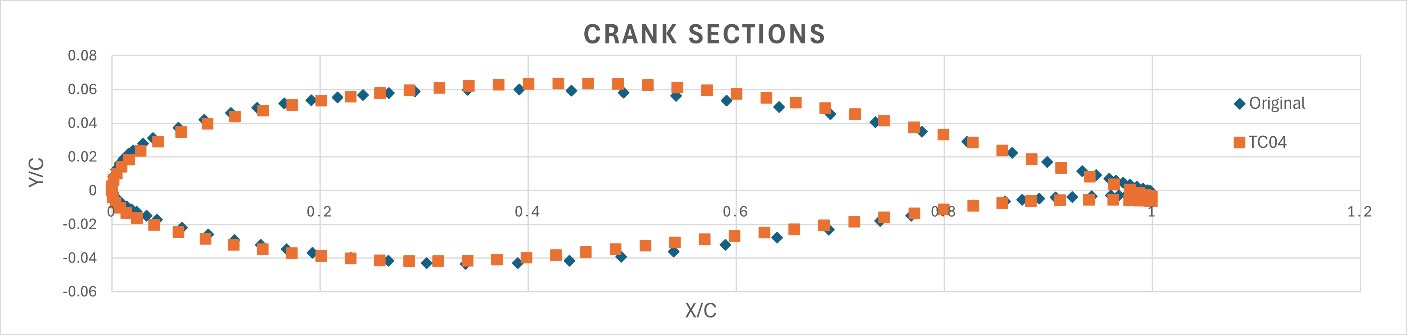
  • Pressure distribution: TC04 replaces the original high-suction rooftop ending in a sharp shock at about 40% chord with a lower-suction rooftop extending to nearly 60% chord, followed by a much more gradual compression.
  • Twist optimisation: with −0.6° of crank twist, the wing reached CL/CD = 24.6 at cruise, up to 5.5% more lift at low incidence and 6.6% less drag at 3.25°. A washout of −1° at the crank and −3° at the tip cut total drag by 5.6% at cruise and 14.3% at 3.5°, and extended the converged range to 3.5°, at the cost of about 5% lift.
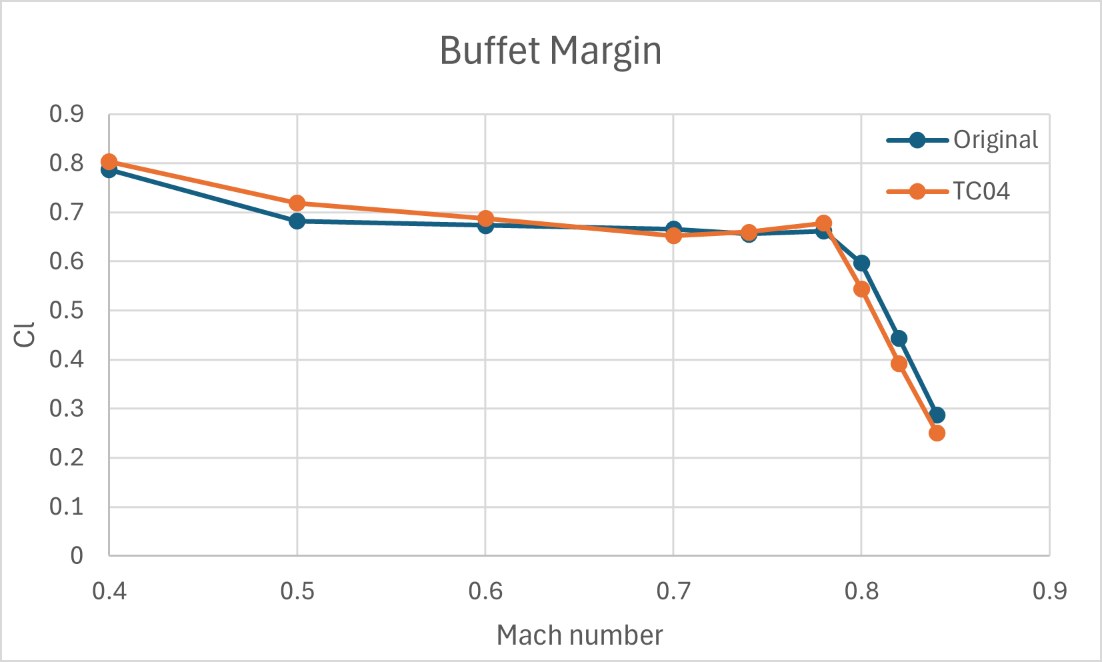
  • Buffet margin: the new design gains lift capability below M = 0.7 but reaches its buffet limit earlier above M = 0.78, because the crank carries more load and its local peak Mach rises to 1.25, a trade-off identified for further work.
Crank aerofoil geometry of the original and TC04 sections
Crank aerofoil geometry: original vs TC04, with a thicker mid-chord and stronger rear loading.
Mach number contours of the original wing (left) and redesigned wing (right)
Upper and lower surface Mach contours: original wing (left) vs redesigned wing (right).
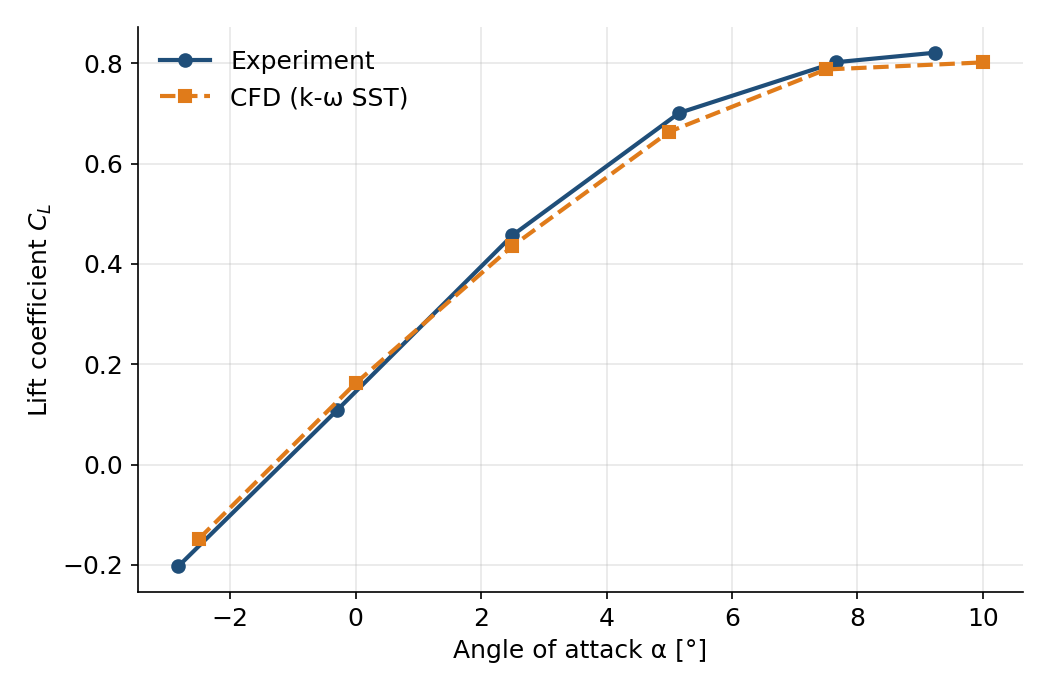
Lift curve from the CFD simulations compared with experimental data
2025 – 2026 · CFD for Aerospace

RANS validation of an aircraft configuration

Steady RANS simulations with the k-ω SST turbulence model on a Pointwise mesh, validated against experimental data. The study compared the predicted aerodynamic coefficients and surface pressure distributions along the span, and assessed where the model is reliable and where three-dimensional effects and flow separation limit its accuracy.

RANSk-ω SSTPointwiseValidation
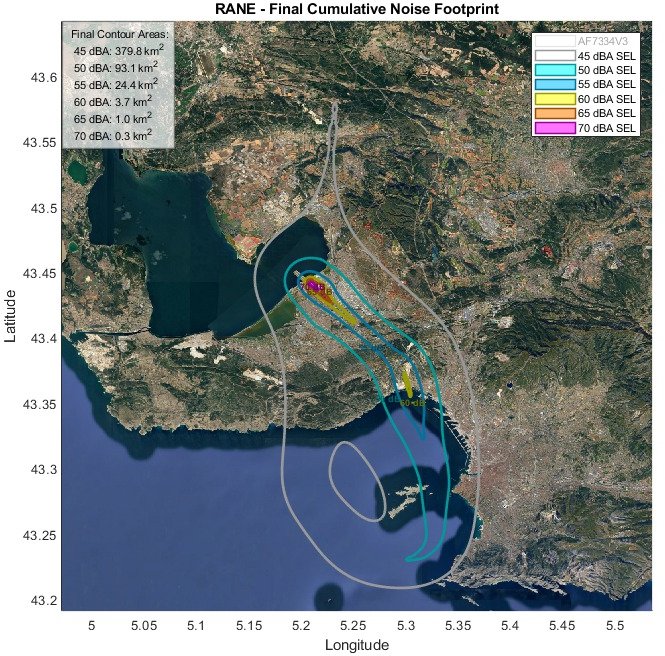
Cumulative noise footprint map around Marseille Airport with colour-coded SEL contours
Cumulative noise footprint of a landing cycle at Marseille Airport (LFML).
2026 · Technology for Sustainable Aviation

Airport noise contour model: Marseille Airport

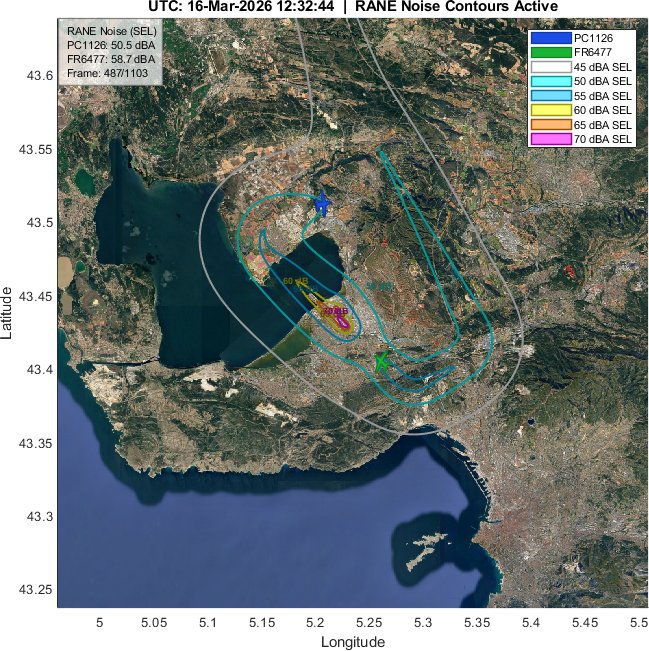
A MATLAB tool that computes noise contours around an airport from real flight trajectories, using a closed-form solution method. Applied to all standard approach and take-off paths on runway 31R at Marseille Airport (LFML), it produces a Flightradar24-style animation of live traffic with its noise footprint.

MATLABAeroacousticsADS-BICAO LTO
▶ Watch the simulation
See more +See less −

Real flight paths were taken from ADS-B Exchange and converted into trajectory data. For every aircraft and every time step, the model computes the 3D distance to each point on the ground and applies a Noise–Power–Distance (NPD) law to estimate the sound exposure level.

  • Directivity: jet noise is not isotropic, so a dipole-type directivity function makes the noise strongest along the flight axis and weakest to the sides.
  • Thrust by flight phase: each trajectory point is classified from altitude and ground speed into taxi, take-off roll, climb, approach, landing roll or stopped, and assigned the matching ICAO LTO-cycle thrust setting.
  • Noise contours: acoustic energy is accumulated over time and across all aircraft, converted back to SEL, and drawn as contours from 45 to 70 dBA, with the enclosed area of each level.
  • Animation: the tool renders a video with adjustable speed and frame rate, showing aircraft moving over the map with their noise footprint.

The method is fast and can be adapted to any airport or flight, making it useful for exploring flight paths that reduce noise over densely populated areas. Its main limitations are that weather and terrain are not modelled, and aircraft are grouped by size category rather than by individual type.

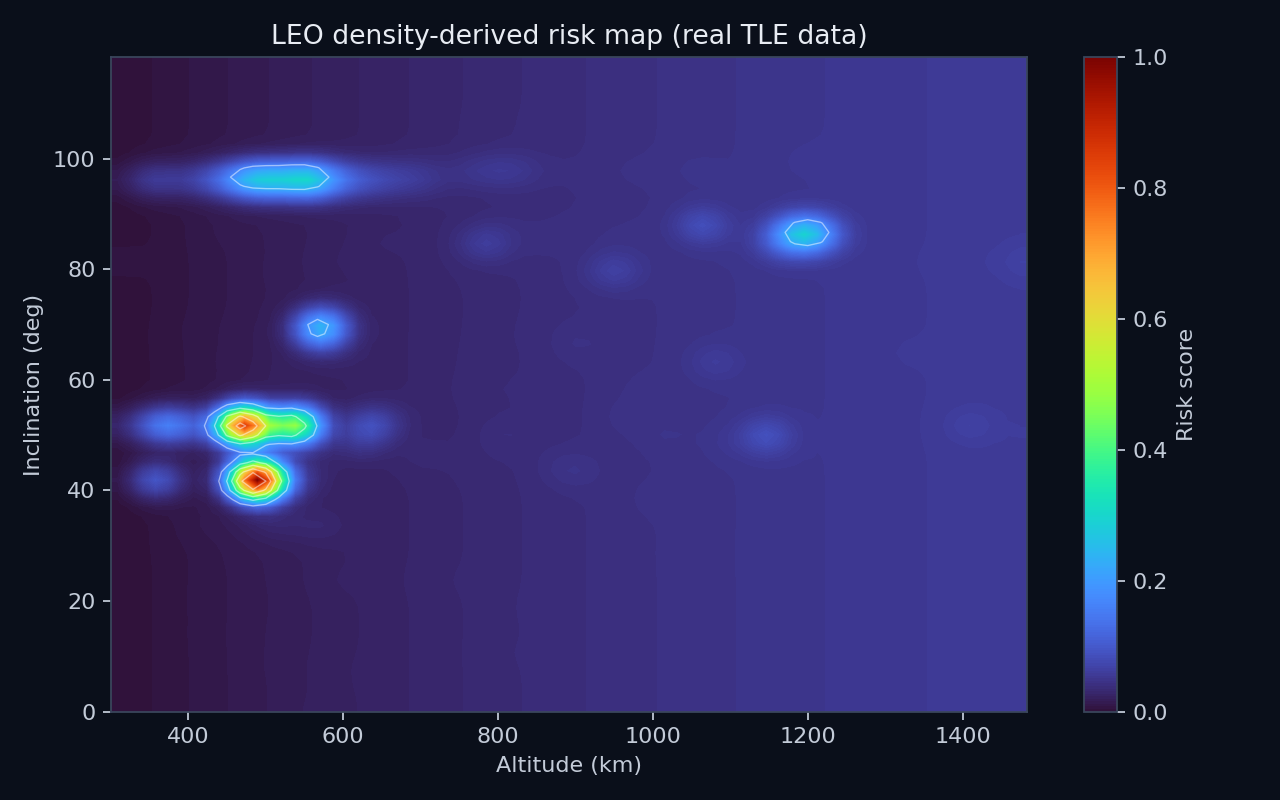
Heat map of orbital risk by altitude and inclination in low Earth orbit, built from real satellite data
2025 – 2026 · Space Entrepreneurship

ORI: Orbital Risk Intelligence

A collision-risk platform for satellite operators and insurers, developed at the European Institute of Innovation for Sustainability. I built the prototype as an interactive Python / Streamlit web app that uses real satellite orbital data (TLEs) to map how crowded each region of low Earth orbit is.

For a chosen orbit, satellite size and mission duration, the app estimates the risk score, debris flux and impact probability, identifies congested bands such as constellation and sun-synchronous corridors, and compares two candidate orbits to recommend the safer one. The project also included the pitch deck, financial model and go-to-market strategy.

PythonStreamlitOrbital data (TLE)Risk modelling